This alluring planisphere (world chart) from 1519 hits a number of famous firsts, and represents–in wonderful colour–the struggle between Spain and Portugal in the early sixteenth century for control of the undiscovered parts of the globe.
It is also a lost map, though as a facsimile and a photograph were made of it before its loss, it is not so tragic a lost map as others. It was last seen in the German Army Library in Munich in 1945. Whether it was destroyed or stolen, no one knows.
Most notably, it is convincingly argued that this lost planisphere was the actual chart produced for Ferdinand Magellan to present to a young Spanish King Charles in February1518, to convince him to finance a voyage to locate the riches of the Spice Islands from the west. These had already been located by the Portuguese from their base in Malacca.
Where Columbus had bumped into the then-unknown Americas in his quest for the Indies in 1498, Magellan would sail south around the bottom of South America, and cross the Pacific Ocean to prove that the Spice Islands were in Spain’s, not Portugal’s hemisphere.
As such, this map is not a navigator’s map, but a political one. Longitude and the circumference of the earth are the crucial elements, and the clove islands of the Moluccas the target. And Kunstmann IV shows these islands on the Spanish side of the world.
WHO MADE IT?
The remaining facsimile is not signed by the mapmaker, although it is almost certainly the work of the prominent father-and-son team, the Reinels of Portugal. The chart is known as Kunstmann IV after being published as part of an atlas in 1859 by German cleric Friedrich Kuntsmann.
The son, Jorge Reinel, was working in Spain earlier in his career after fleeing Portugal following a knife fight with a priest. He was already familiar with his father’s cartography, and was engaged by Magellan’s team to prepare the Kunstmann IV planisphere. His activities assisting Spain were noted by Portugal’s consul in Seville, and there was even talk of a contract on his life for what was widely regarded as treason. Pedro travelled to Seville to bring his son back home, and was obliged to assist in finishing the map to expedite this.
Pedro, in the vanguard of Portuguese cartography, had drawn the oldest, signed surviving portolan chart in 1485, and continued as a court mapmaker making his last chart just before his death in 1540. Jorge, who drew most of Kunstmann IV, worked as the court chart and compass master for decades after his father, training the next generation of Portuguese cartographers.
WHY IS IT IMPORTANT?
It is the first world map to show the full circumference of the globe at the equator. And it is also the first chart to provide a graduated 360º of longitude, which you can see, as tiny golden diamonds also along the equator.
It is the first complete world map, as it shows the Pacific Ocean and its estimated extent (first sighted by Spaniard Vasco Balboa in 1513), here called the ‘Sea of the Spanish’.
It is also the first world map that shows only known coastlines; those sighted and charted by sailors on ships or explorers on land. All other previous world maps (see for example the 1503 Cantino Planisphere) were a mix of visual sightings and where these were lacking, the cartographer added coastlines generally according to Ptolemy (from back in the first century).
And though it was used by a renegade Portuguese adventurer to elicit funds from a Spanish king, this planisphere correctly represents the most accurate real geographic knowledge of 1519; the Portuguese at this time knowing more about global geography than anyone else.
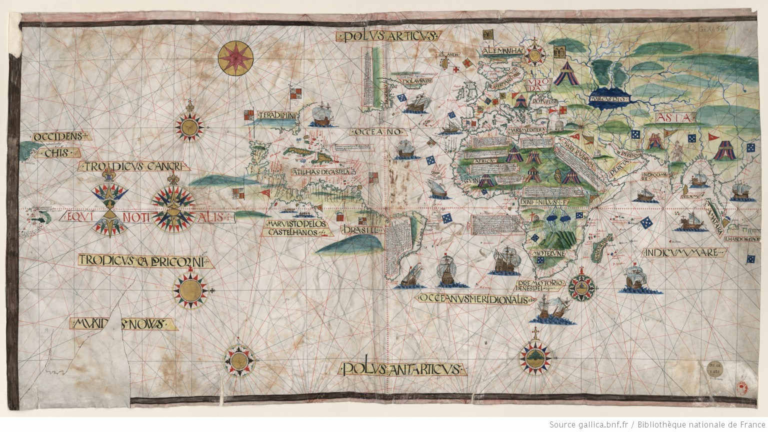
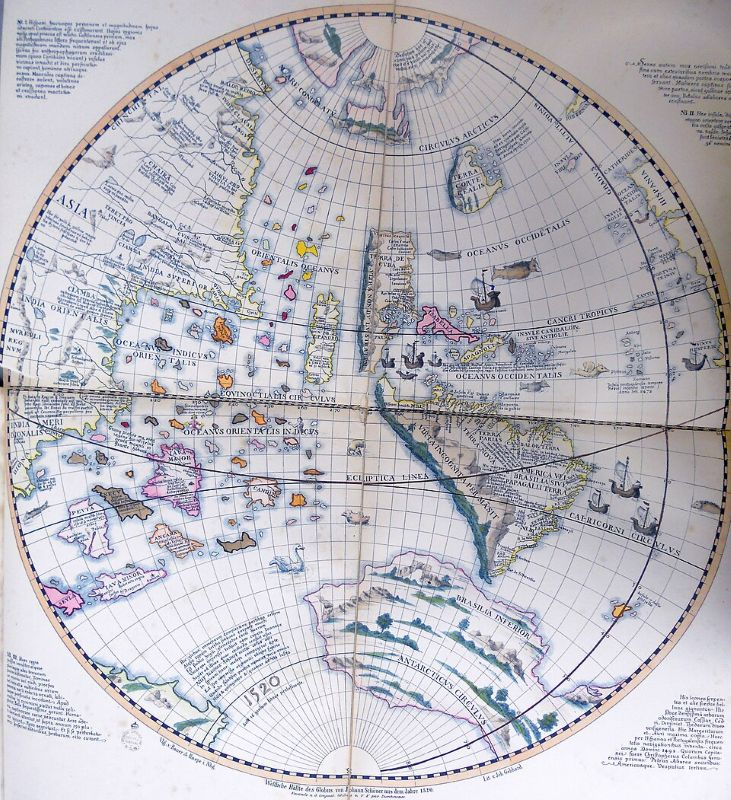
WHAT DOES THE CHART SHOW?
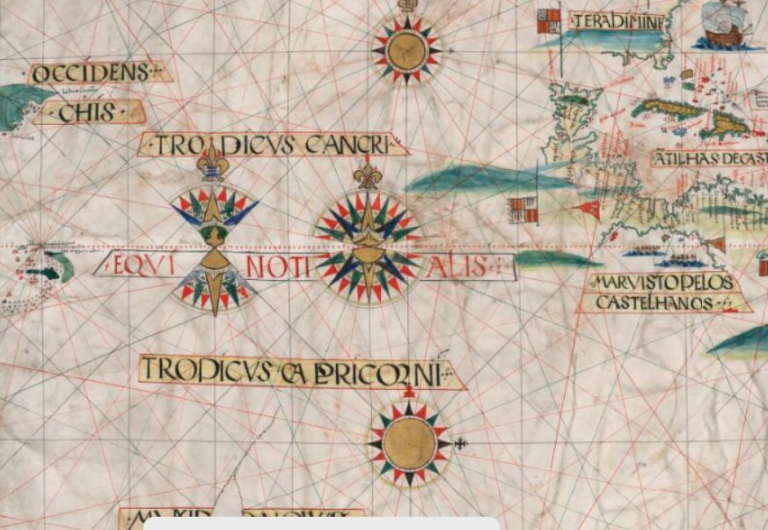
From Iceland, Greenland and Newfoundland in the Arctic north, all the way to China; that green cape called ‘CHIS’ on the upper left. The Spice Islands sit south of China. Japan, New Guinea and Antarctica are missing, as well as more definition needed of the American continents, but considering only a generation before the Americas were unknown and scholars thought the Indian Ocean a closed lake, it is an amazing progression.
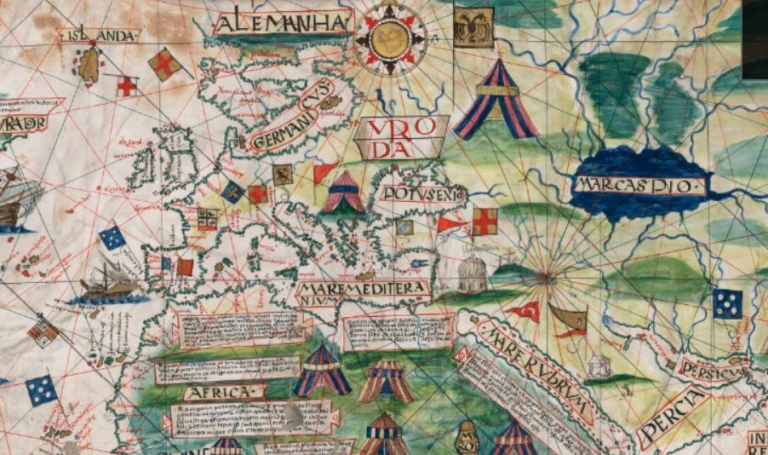
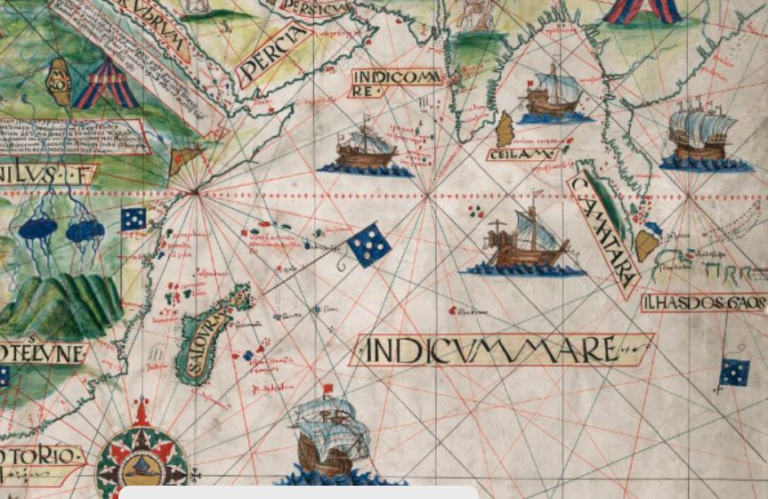
The finely drawn artwork with abundant coloured illustrations and detailed calligraphy is impressive and typical of other Portuguese charts of the same era (Cantino, Miller Atlas, etc). The painted tents of African and Asian kings, the indented coastlines, realistic ship images–including local vessels in the Indian Ocean and a ship being dis-masted off the Cape of Good Hope, rhumb lines and windroses all add to the planisphere’s appeal.
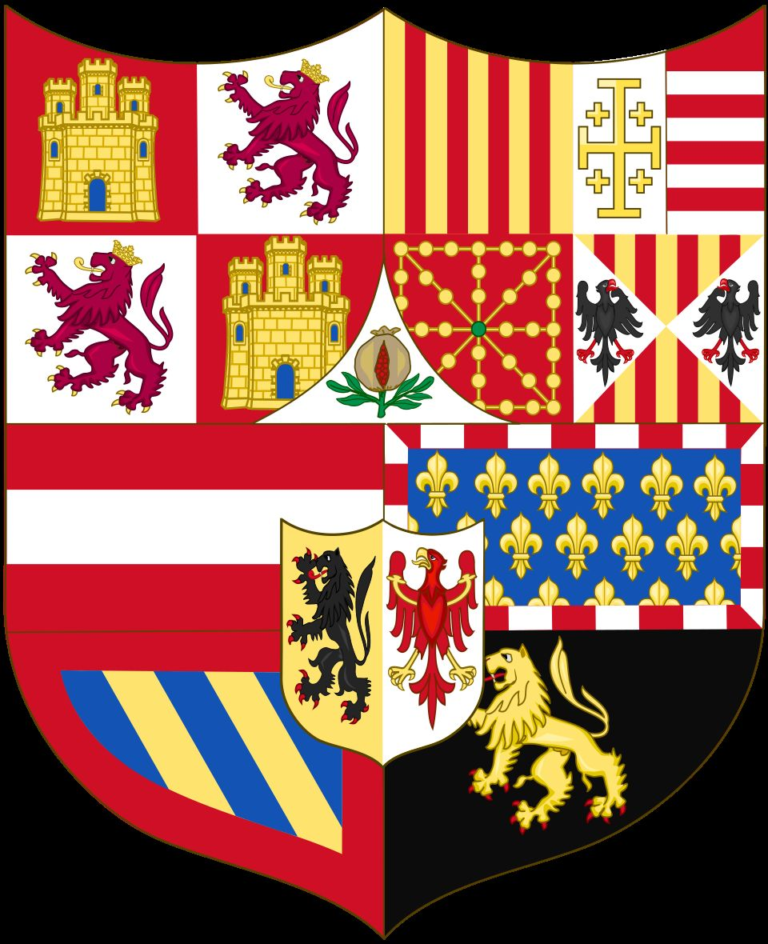
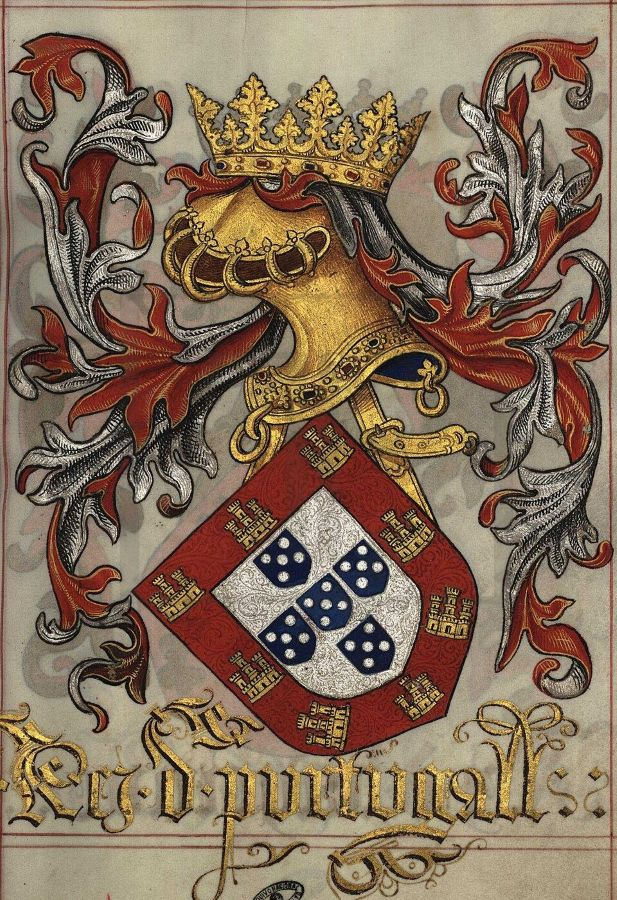
Notable is the division of the world by the vertical line of the Tordesillas Treaty of 1494 (the graduated line down the centrefold of the map). You can see the red heraldic flags signifying Spanish domains in the Americas, while the five white castles on a dark blue flag represent Portuguese realms.
These latter realms extend all the way from Brazil, east across Africa, the Persian Gulf, India and on through the Indies to China, which a Portuguese embassy reached in 1513. You can clearly make out India, Ceylon, Sumatra, the Malay peninsula and the island chain extending east through Java, Bali and Lombok.
But then comes the end of this chart: the supposed anti-meridian of the Tordesillas line. And to find the Spice Islands you have to return to the other side of the map. To the Spanish side. Brandishing this map, Magellan said to King Charles, ‘the wealth of the Spice Islands is yours, sire, not Portugals’.
It was a pretty convincing argument, the king–imagining his entitled riches–was convinced, and provided the funding for the expedition. After all, Magellan had already sailed to Malacca, right on the eastern edge of this map. He should know.
But Magellan was wrong. His mapmakers had underestimated the width of the Pacific, which wouldn’t be understood until he reached the Philippines in 1521. The Spice Islands were actually in Portugal’s hemisphere (by just over 880 nautical miles, or about 14 degrees; not a lot).
It wasn’t the first time the Spice Islands had been portrayed on a map; they had been shown by Pedro Reinel in his chart of the Indian Ocean of 1517 (also held in Munich and lost in WWII, but thankfully also copied). This reflected the discovery of the Banda Islands in 1512 by Antonio Abreu. But the same mapmaker, and his father, showed them on Kunstmann IV and provided an estimate of their longitude.
Yes, the Reinels and Magellan got that longitude wrong, but at the time given the limitations of their navigation equipment, it was an honest error, not a deliberate ploy to mislead King Charles. It would not be until marine chronometers were invented in the late C18th that accurate longitude could be calculated.
WHAT HAPPENED NEXT?
When the survivors of Magellan’s expedition returned to Spain in 1522 (Magellan was killed in the Philippines, and the voyage was completed under Elcano), the navigators were interviewed by Spain’s chief cartographer, Nuno de Toreno, and he produced a chart of the Indian Ocean.
This chart showed the Spice Islands definitely in the Spanish hemisphere, and by a great amount of longitude. Perhaps it was not deliberate deception by the Spanish, but in any case, this map was provided to the Portuguese as ‘proof’ the islands belonged to Spain.
But Portugal was not giving up its Spice Islands easily. A kilo of cloves bought with linen worth two reals in Ternate sold for 700 reals in Lisbon, a markup of 35,000%. Both Spain and Portugal built fortresses in the Spiceries, and they fought it out for a few years in the tropics, while negotiating the anti-meridian back in Europe.
Eventually at Saragosa, Spain in 1529, King Charles gave up his claim to the Moluccas in return for 350,000 gold ducats (or 1.2 tonnes of gold!). His post-Magellan/ Elcano expeditions to the Spice Islands had struggled with the arduous Pacific crossings, and he was short of funds. The size of Portugal’s payment indicated the worth it assigned to the islands.
And in the several conferences negotiating these issues between the Iberians, who represented Portugal? The father and son Reinel cartographers, of course. Whereas before they had worked in Spain preparing Magellan’s maps, they were back in their homeland, defending it.
So, while it is a disaster that the 63 x 120 cm original of Magellan’s map has been lost, this is somewhat ameliorated by German Army officer Otto Pregel’s coloured facsimile from 1843 (held in the National Library of France) that allows us today to take in the atmosphere and politics of this wonderful planisphere by the Reinels.
Sources for this article include the Gaspar/ Kritalic Cartogrpahy of Magellan; Ivan Kupcik’s the Munich Portolan Charts; Bergreen’s Over the Edge of the World; and Rossfelder’s In Pursuit of Longitude.
I hope you enjoyed this piece of cartographic history. If you did, please consider subscribing below, to be notified of new blog posts.